Title
Right-aligned display of bar chart numerical labels
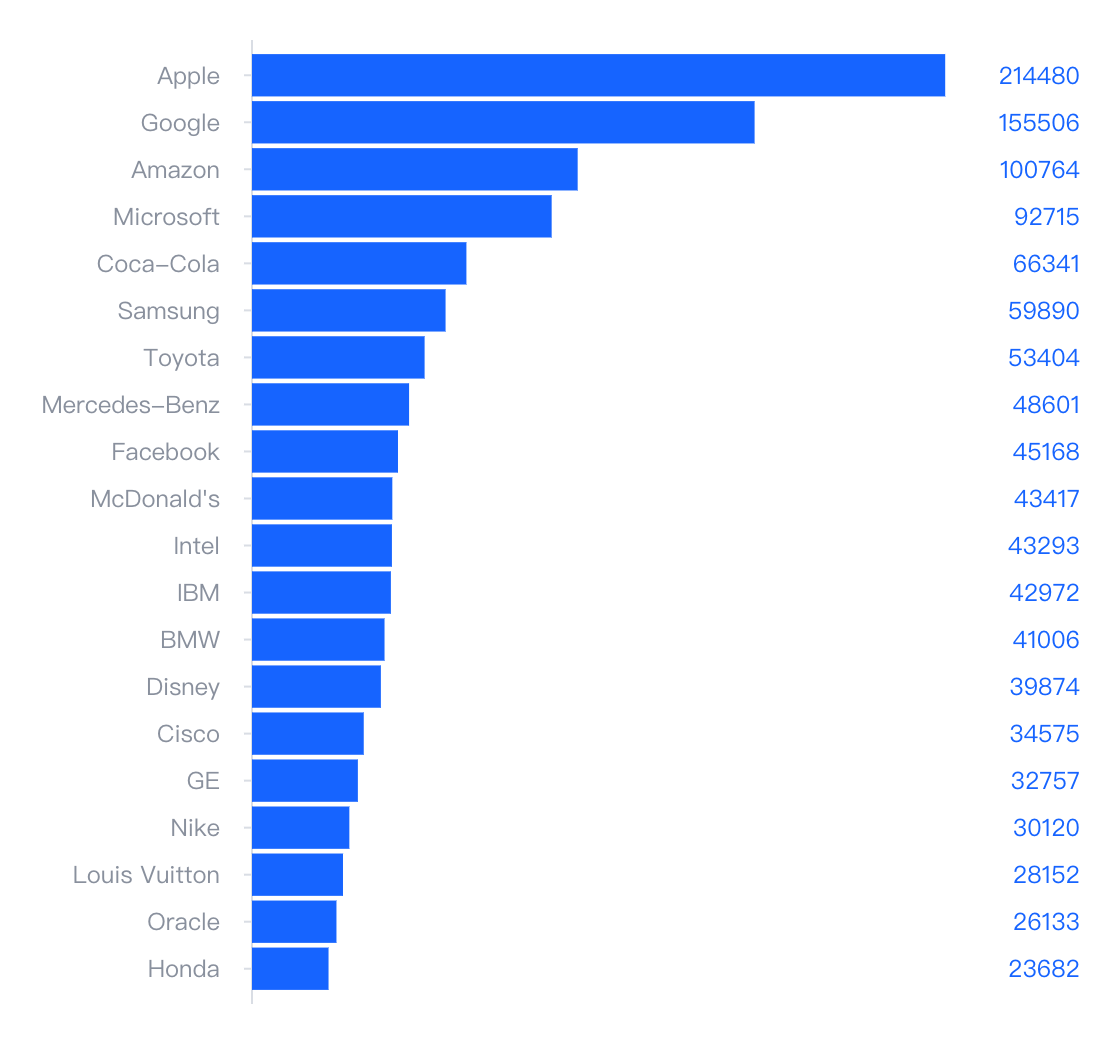
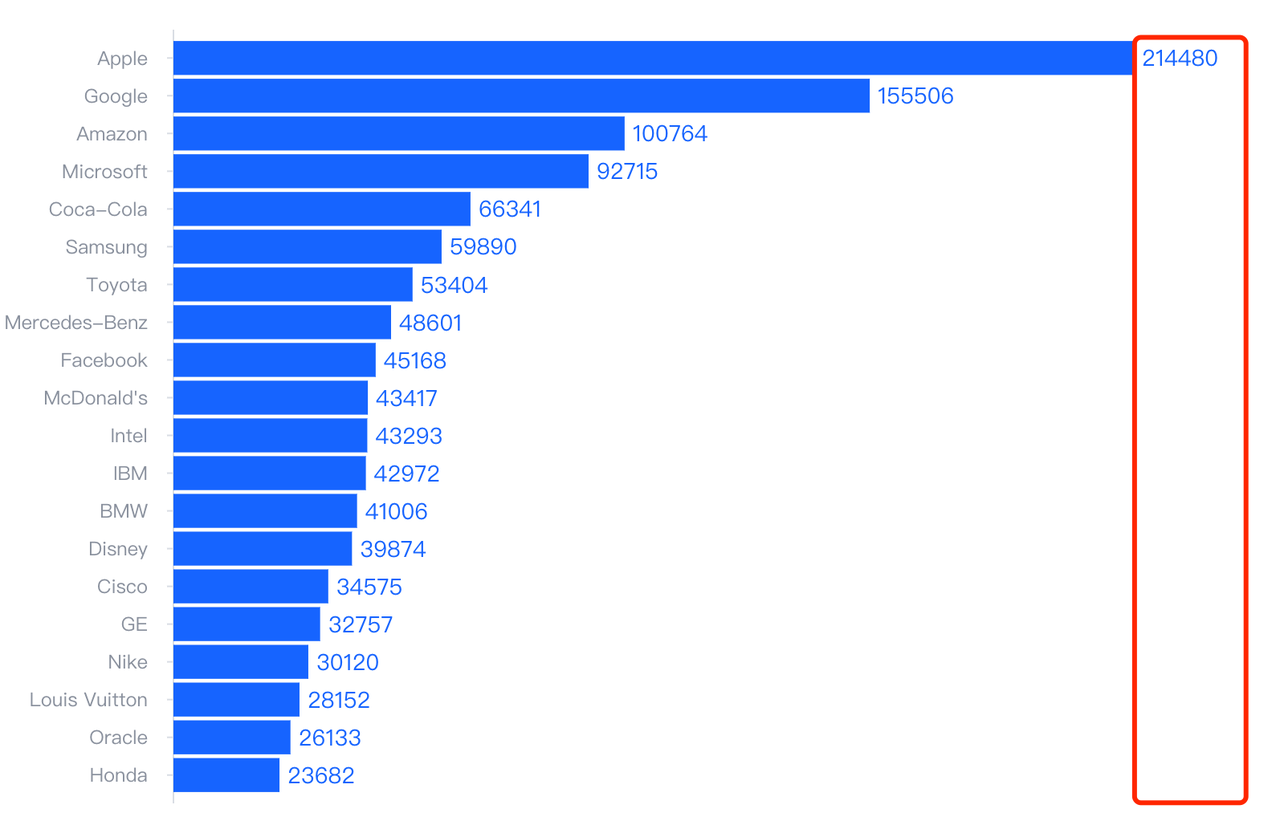
Description
Display the labels uniformly on the right and align them to the right.
Solution
You can use the extensionMark property provided by VChart to implement it through custom graphics.
Code Example
const spec = {
  type: 'bar',
  data: [
    {
      id: 'barData',
      values: [
        {
          name: 'Apple',
          value: 214480
        },
        {
          name: 'Google',
          value: 155506
        },
        {
          name: 'Amazon',
          value: 100764
        },
        {
          name: 'Microsoft',
          value: 92715
        },
        {
          name: 'Coca-Cola',
          value: 66341
        },
        {
          name: 'Samsung',
          value: 59890
        },
        {
          name: 'Toyota',
          value: 53404
        },
        {
          name: 'Mercedes-Benz',
          value: 48601
        },
        {
          name: 'Facebook',
          value: 45168
        },
        {
          name: "McDonald's",
          value: 43417
        },
        {
          name: 'Intel',
          value: 43293
        },
        {
          name: 'IBM',
          value: 42972
        },
        {
          name: 'BMW',
          value: 41006
        },
        {
          name: 'Disney',
          value: 39874
        },
        {
          name: 'Cisco',
          value: 34575
        },
        {
          name: 'GE',
          value: 32757
        },
        {
          name: 'Nike',
          value: 30120
        },
        {
          name: 'Louis Vuitton',
          value: 28152
        },
        {
          name: 'Oracle',
          value: 26133
        },
        {
          name: 'Honda',
          value: 23682
        }
      ]
    }
  ],
  direction: 'horizontal',
  xField: 'value',
  yField: 'name',
  axes: [
    {
      orient: 'bottom',
      visible: false
    }
  ],
  label: {
    visible: false
  },
  extensionMark: [
    {
      type: 'text',
      dataId: 'barData',
      visible: true,
      style: {
        text: datum => datum.value,
        fontSize: 12,
        x: (datum, ctx) => {
          return ctx.getRegion().getLayoutRect().width + 10;
        },
        y: (datum, ctx) => {
          return ctx.valueToY([datum.name]) + ctx.yBandwidth() / 2;
        },
        textBaseline: 'middle',
        textAlign: 'right',
        fill: "#1664FF",
        fontSize: 12
      }
    }
  ]
};

const vchart = new VChart(spec, { dom: CONTAINER_ID });
vchart.renderSync();

// Just for the convenience of console debugging, DO NOT COPY!
window['vchart'] = vchart;</br>
Result